Lower VWAP Examples during Late Morning + Afternoon
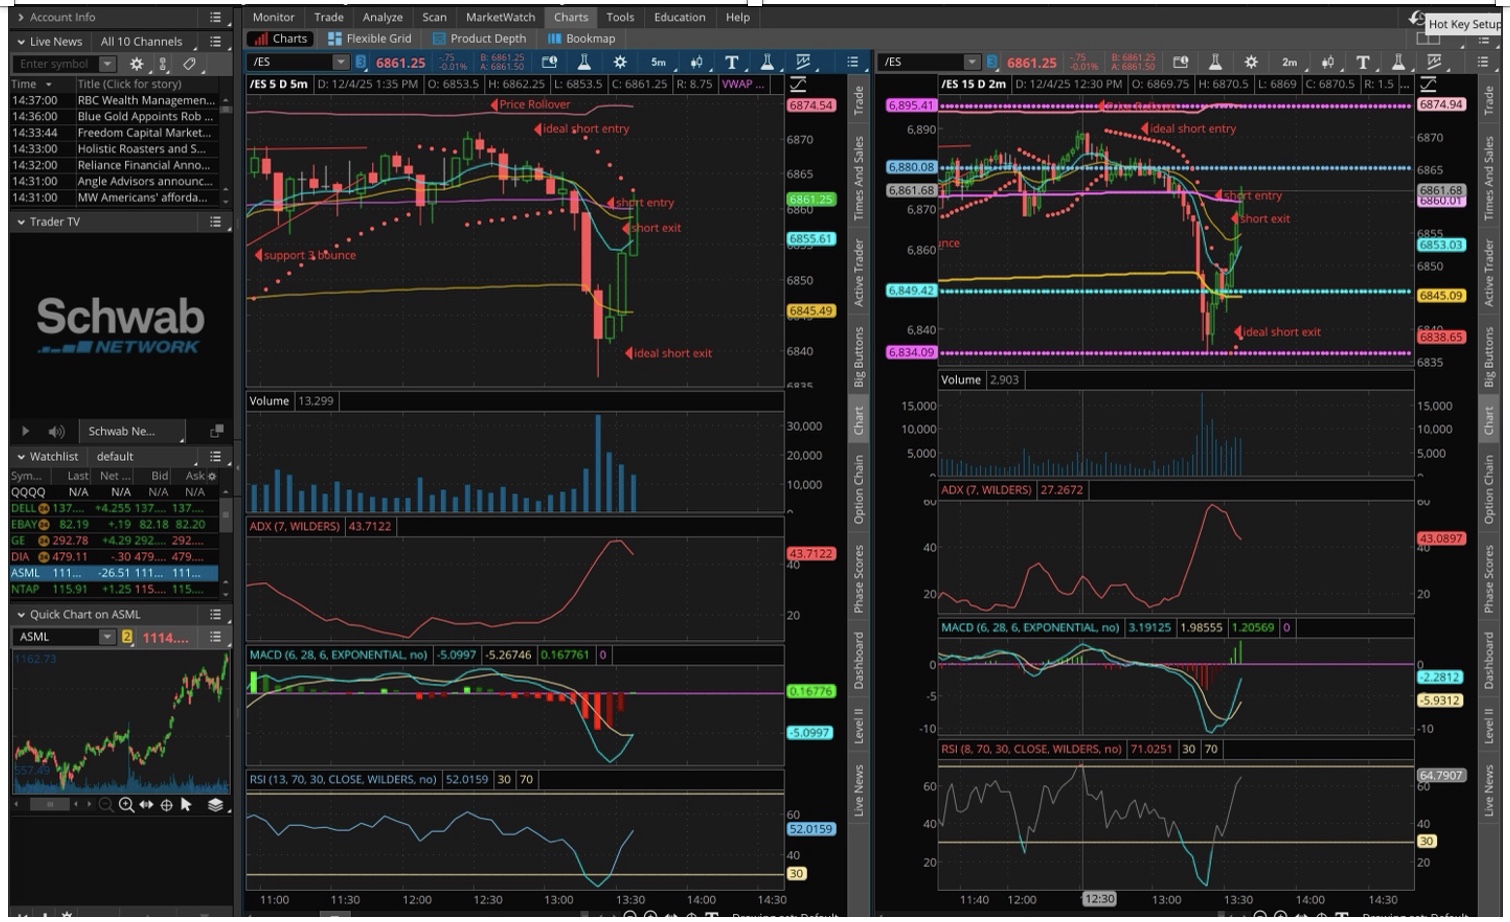
The morning is the time I like to trade ideally - right around or after the market open - however the later morning - after 10:30 eastern, and afternoon around 1pm eastern are both also great times to trade - and great times to see patterns. Here is another look at the lower VWAP reverse -
What I notice are two things - the time it reverse - and the way it reverse - when it is later in the day I look more closely at the other indicators. What are they doing - where are their signs of patterns like a rectangle or head and shoulders or wedge / triangle or broadening pattern on the indicator - where is it showing a rounded bottom or area of momentum that might work out -
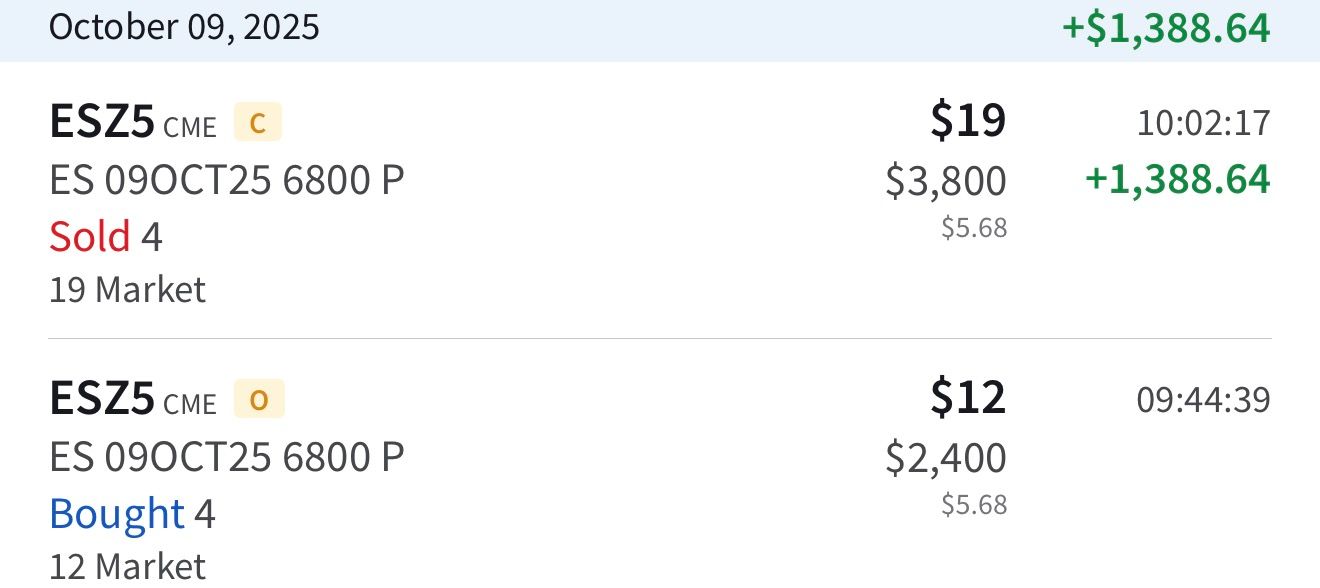
Here is a 4 to 1 example that goes from a low of $4 up to $16 in a short amount of time - this corresponds to a $200 raw risk (50% value x 100 x strike price) to $800 profit.
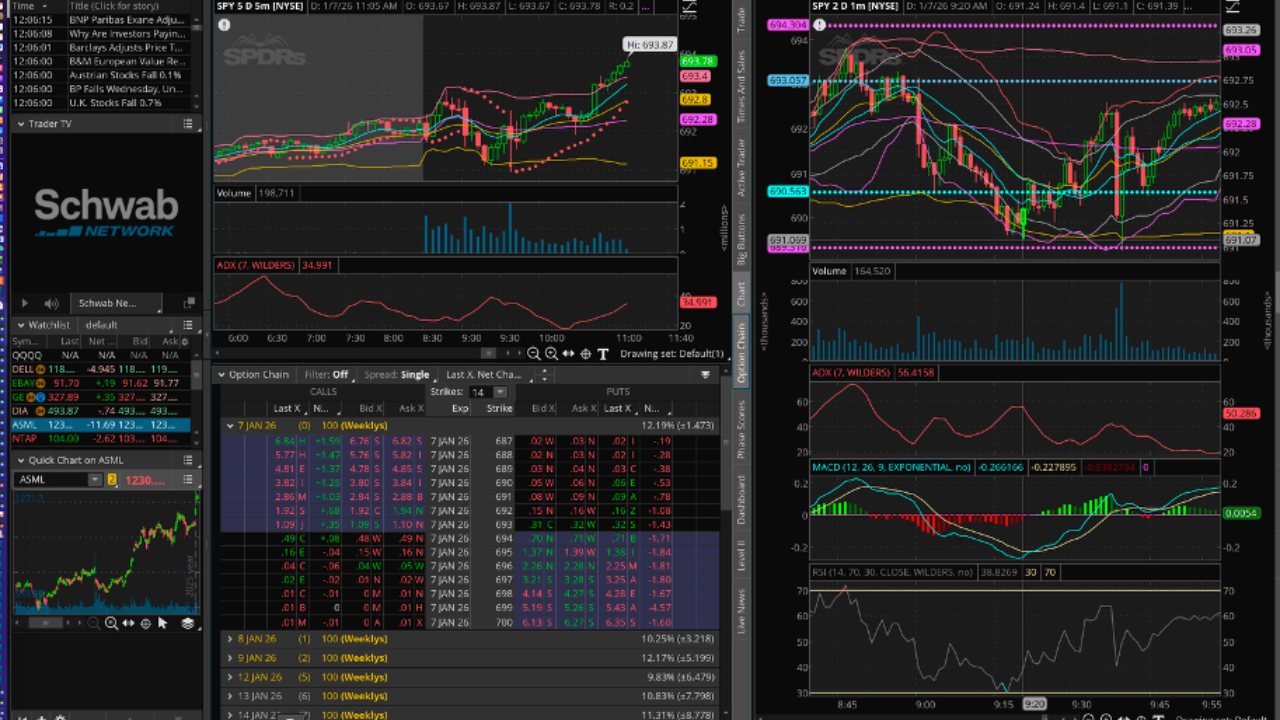
You can see the trend reversed near an area the Average Directional Index (ADX) was already topping out, and all of the lower indicators - S...
My trading, set ups and a V2 of the trade book
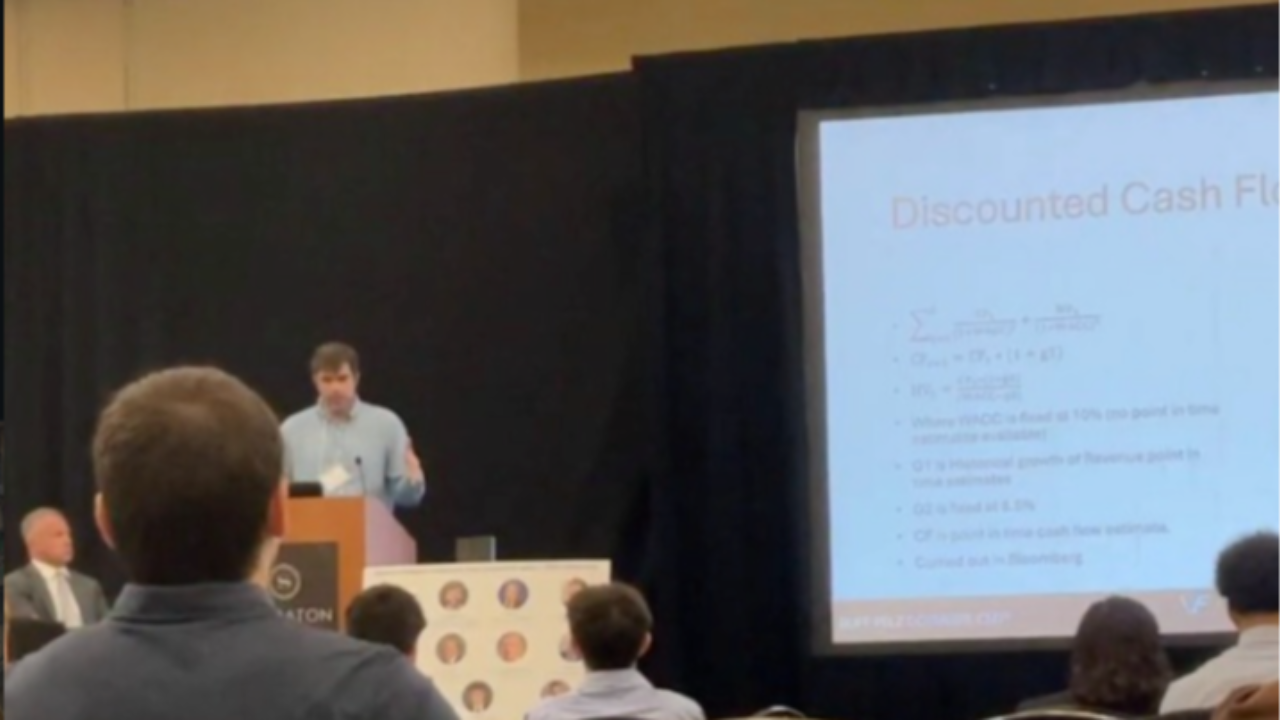
During the first trade book I was able to find some solitude and peace in trading by staying in a hotel to separate my trading from the rest of the world and enjoy some focused time - focusing on it. I was able to put together an exact system of identified entries - the underlying options movement - the price image with my indicators at the start of the move - the price image with my indicators after the move - and the price image later in the day to see what would have been the best decision with that trade.
The result is a repeatable set of patterns that are option ready to manage risk, an understanding of the underlying option movement around these key intraday set ups. For example, after the open - an opening range breakout pattern (made popular by Andrew Azziz - Carlos Zattarini in their white paper + book by Azziz and BearBullTrades.com trading system) - however what is not covered is the underlying options movement. I went and gathered by hand data around the underlying option...
Intraday 3 to 1 chart pattern
The Lower VWAP Bounce: A High Reward-to-Risk Futures & Options Setup
After a sharp selloff near the market open, panic often creates opportunity. One of the recurring patterns identified in the $45 Tradebook is what I call the Lower VWAP Bounce Setup — a tactical reversal pattern built around oversold momentum, trend exhaustion, and a reclaim of the lower VWAP support zone.
This setup is designed to target approximately a 3-to-1 profit-to-risk ratio, allowing traders to risk small while positioning for a fast intraday move.
What Is the Setup?
The pattern begins with:
-
A sharp market selloff near the open
-
Momentum indicators becoming deeply oversold
-
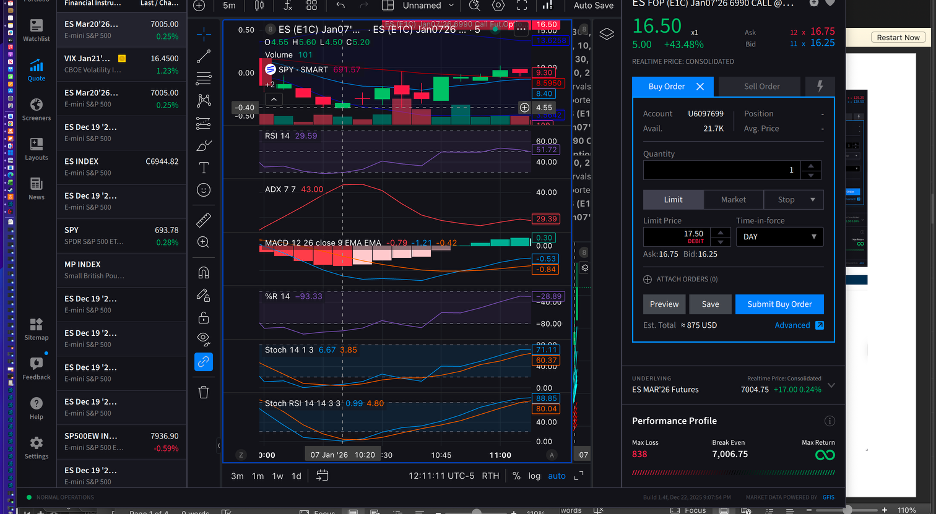
Price reaching or slightly breaking the lower VWAP band (yellow line)
-
Signs of selling exhaustion and stabilization
-
A quick reclaim or bounce from the lower VWAP area
In the screenshots above, the E-mini S&P futures (/ES) sold off aggressively before bouncing directly from the lower VWAP support region.
Th...
Author

Matt Lutey
Professor | Finance PhD
Dr. Lutey is a professor and finance PhD